Unmixing fluorescence signals - a powerful tool in the Life Sciences
In the following application, researchers were interested in determining where plant disease resistance proteins are active and which function they display from various locations within a cell.
In the depicted example, a nuclear exclusion signal was fused to the protein of interest tagged with Yellow Fluorescent Protein (YFPvenus). Stable transgenic plant cells were subsequently imaged under a confocal microscope. Initial analysis showed that the plant cells displayed high levels of autofluorescence overshadowing the actual fluorescence signal of interest which was detected in various compartments across the cell. Furthermore, the protein of interest was expressed at low levels and appeared in unexpected localisations, therefore first results were inconclusive.
The ANU's Zeiss 780 Confocal located within CAM allows user-friendly spectral imaging-linear unmixing to separate specific fluorescent emission from cellular autofluorescence. Although autofluorescence can be very useful for providing clues on the metabolic state of your cells, it can also prove to be challenging to differentiate between fluorescence signals when using traditional filter systems (Fig. 1).

Fig. 2
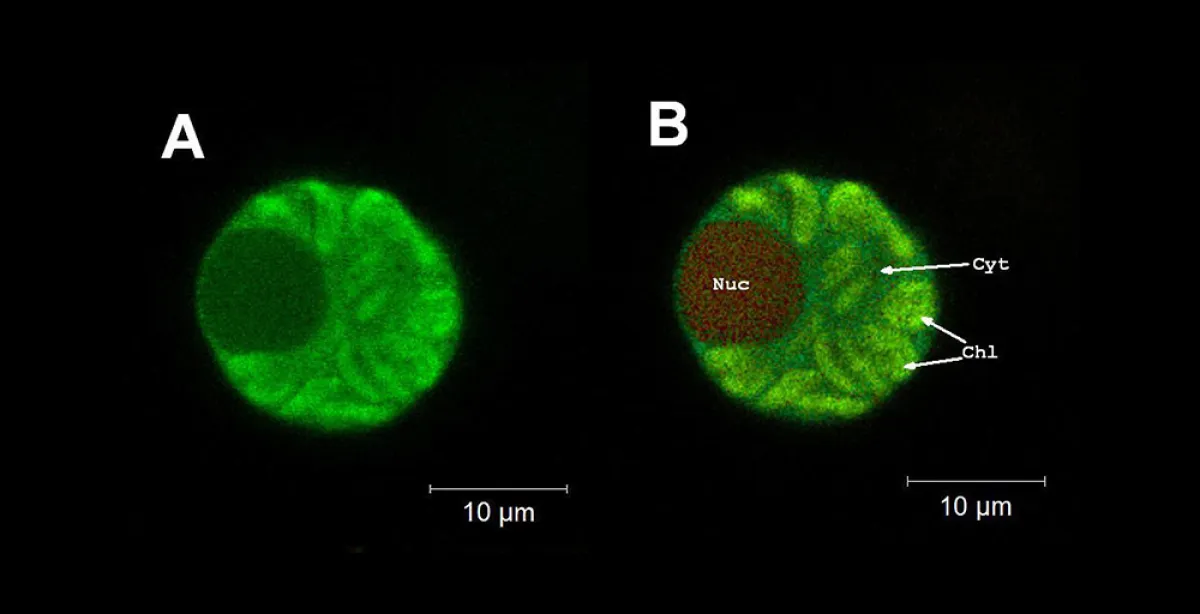
Fig. 1: Wheat mesophyll protoplast expressing a fungal resistance protein fused to Yellow Fluorescent Protein (YFPvenus). In this cell the protein has been modified and is expected to be excluded from the nucleus. The first image (A) shows the YFPvenus localisation as determined by confocal microscopy using a traditional narrow band YFP filter (excitation: 514nm; emission: 520-560nm). The second image (B) is the same cell, presented as a true colour representation of multichannel spectral data, collected on the Zeiss 780 Confocal (excitation: 514nm; 14 channels, range 520-645nm). Both images give the impression that the YFPvenus fusion protein is expressed at high levels in the chloroplast (Chl), moderate levels in the cytoplasm (Cyt) and at low levels in the nucleus (Nuc).
The right panel of Fig.1 shows the YFP narrow band (520-560nm) filter detection region highlighted in green, with spectra extracted from the data set associated with image B shown as dotted or dashed lines. Spectral analysis of this protoplast revealed two distinct sources of autofluorescence (from the chloroplasts and the nucleus) overlapping the YFPvenus signal of interest.
Fluorescent emission from both the nucleus and chloroplasts is clearly present in the YFP filter narrow band detection region and as such cannot be distinguished from YFPvenus in Image A.
Spectral imaging merges the disciplines of microscopy and spectroscopy into a combination that enables determining both the intensity and spectral properties of a specimen for each pixel in an image. Using this strategy, users will obtain an image where autofluorescence can be unmixed from the signals of interest, and thus be reduced or eliminated completely (see Fig 3).
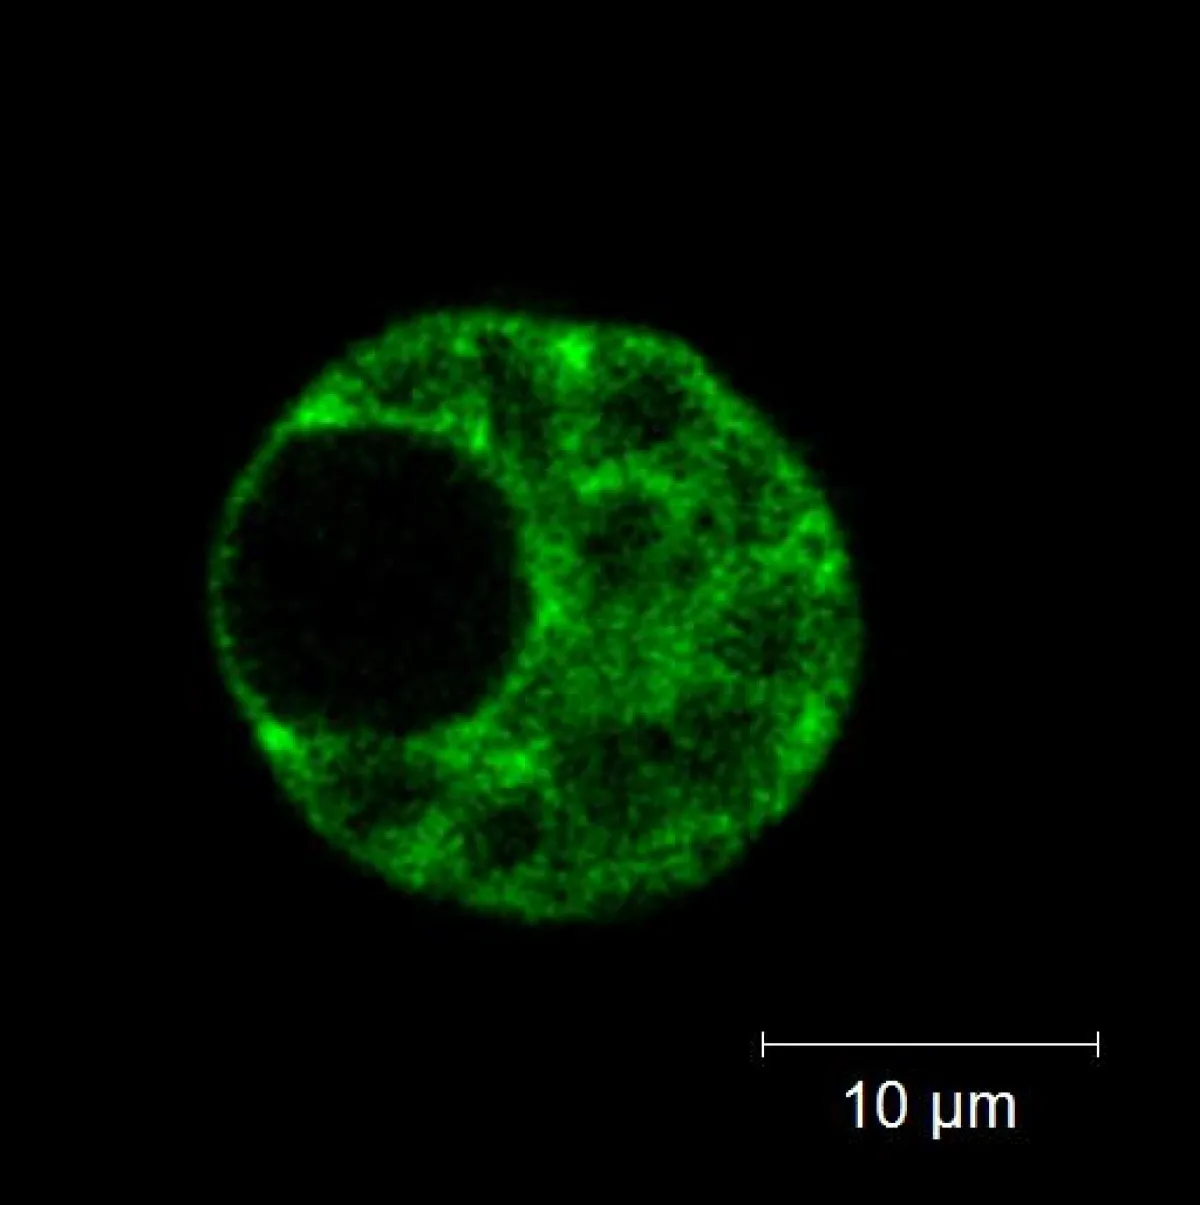
Fig. 3: The YFPvenus localisation obtained by linear unmixing of the spectral data set from Figure 1B
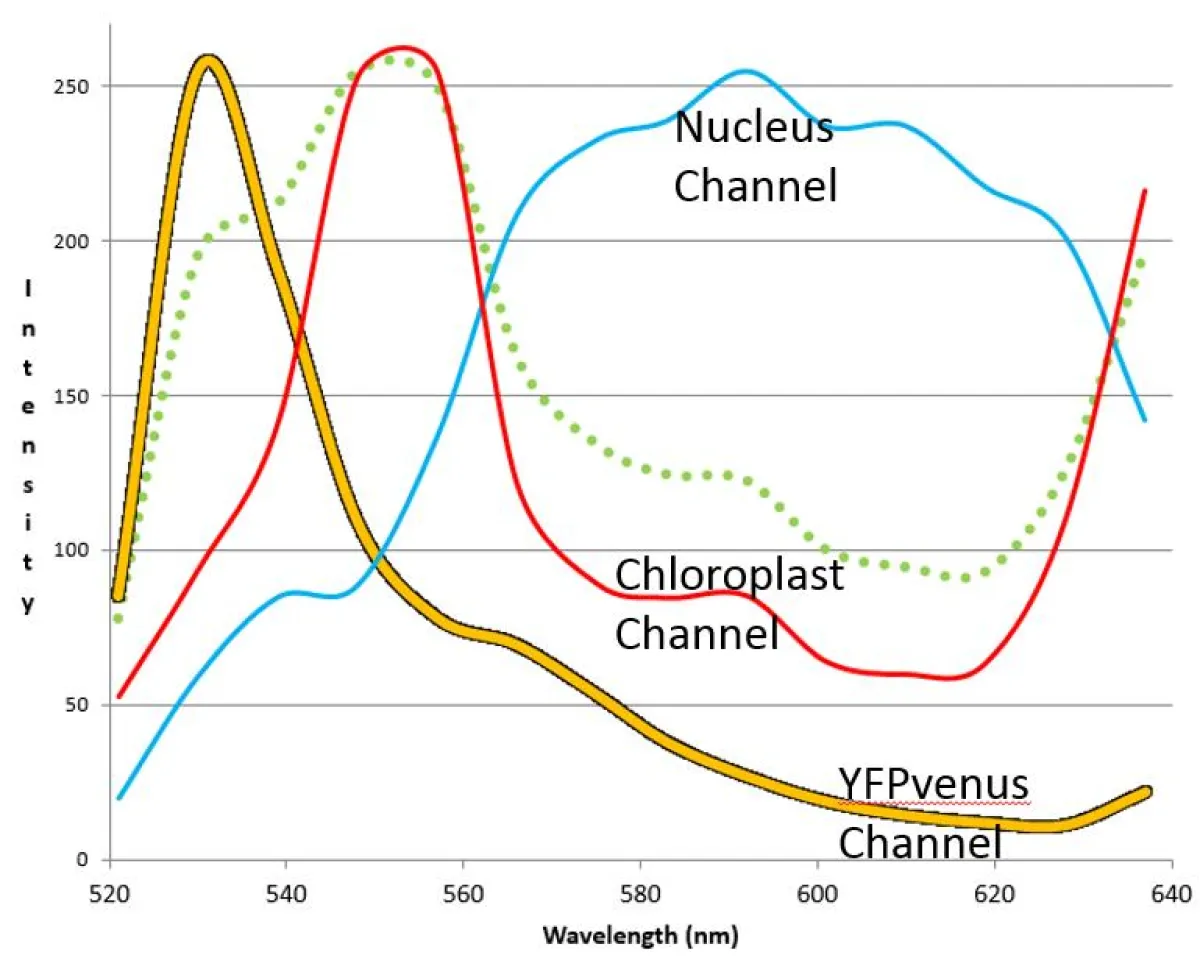
Fig. 4: Individual spectra 'channels' used for unmixing the data set for Fig. 3
Fig. 3: Shows an image of the YFPvenus localisation obtained by linear unmixing of the spectral data set from Figure 1B. Linear unmixing extracts each identified compound as a separate channel based on its spectra, resulting in more accurate localisation.
Spectral unmixing revealed that the YFPvenus fusion protein is restricted to the cytoplasm. There is no YFPvenus present in the nucleus or chloroplasts. The right panel of Fig. 2 depicts the individual spectra 'channels' used for unmixing.
Figures 1 and 3 support different conclusions about the localisation of the YFPvenus fusion protein and the effect of the nuclear exclusion modification. This example demonstrates clearly that even a narrow band filter is unable to separate the YFPvenus signal from the autofluorescence in this specimen.
The more accurate interpretation available from spectral unmixing provided Stella Cesari and colleagues (Cesari et al., 2016) definitive evidence that their protein of interest provided both disease resistance and cell death signalling only when located in the cytosol in contrast to another studied protein, which provides cell death signalling from the cytosol, and disease resistance from the nucleus.
For further information, please see Cesari et al, Cytosolic activation of cell death and stem rust resistance by cereal MLA-family CC–NLR proteins, 2016).
In addition to providing the ability to separate specific signals from autofluorescence as described above, spectral imaging also allows for increased acquisition speed and detection sensitivity for multichannel imaging where multiple dyes are used in an experiment.
A side effect of the traditionally used narrow band filter detection is that much of the real signal from a fluorophore must be rejected in order to avoid cross talk, making the detection less sensitive. Each additional track increases scan time, leading to photobleaching and if your sample moves even the slightest amount your data is compromised.
Using a spectral imaging - linear unmixing approach eliminates all of these problems. You collect your data faster, and with higher signal to noise. Spectral imaging collects all the photons from every fluorophore at once, in a single acquisition event. Linear unmixing is then used to determine the relative contribution from each fluorophore for every pixel of the image.
Linear unmixing also has the ability to separate fluorescent probes that would otherwise have too much emission overlap to be resolved, for example Alexa 488 and eGFP.
Linear unmixing can be performed either as post processing, or live during acquisition (online fingerprinting). Each approach has its benefits and drawbacks, which we are happy to discuss with you.